| 7.4. The Issue Frame | ||
|---|---|---|
 | Chapter 7. Reading the Report |  |
| 7.4. The Issue Frame | ||
|---|---|---|
| | Chapter 7. Reading the Report | |
The issue frame shows detailed information about a specific loop or issue. The exact contents of the frame depend on whether it is displaying a loop or an issue, and if it is an issue on the type of issue.
The issue frame consists of a number of sections. By default most of them
will be collapsed and only display the title of the section and an expand
button,  , to the left of the title. Clicking the expand
button shows the contents of the section.
, to the left of the title. Clicking the expand
button shows the contents of the section.
To collapse an expanded section click the collapse
button,  , to the left of the section title.
The diagrams and all numbers presented here are for the currently selected part of the application. See Section 7.1.2, “Reading the Diagrams” and Section 7.1.1, “Reading the Statistics”.
In addition, for cache line utilization related advice, the statistics also report the fraction of the total fetches that would be avoided if the program was modified so that it achieves perfect utilization. See Section 4.8, “Utilization Corrected Fetch Ratio”. This helps you estimate the potential gain in addressing the issue. Other types of actions, such as loop fusion or blocking, can reduce the fetches even further.
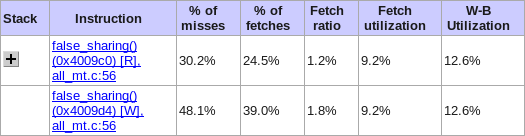
The issue frame also contains lists of instructions regardless of if it is showing details for a loop or for an issue.
Figure 7.20, “Instructions with Collapsed Call Stack” shows an instruction group containing two instructions.
The address of each instruction is presented in the instruction column. If debug information is available, the function the instruction is part of, and the source file and line number that generated the instruction are also presented.
In this case the instructions at address 0x400516 and 0x400526 belong
to the function main and is part of line 51 in the
file demo.c.
The expand button, , in front of the line indicates that there is call
stack information available telling us where the instruction was called
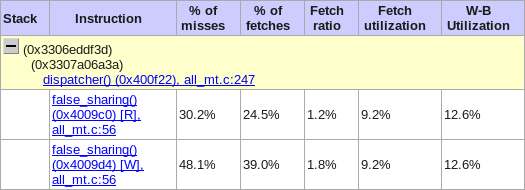
from. Clicking the button expands the call stack information.
This tells us that the function the instructions are part of was called from the instruction at address 0x386fe1e074, and that function was in turn called from the instruction at address 0x4003b9. Debug information was not available for these functions, otherwise the functions names, file names and line numbers would have been displayed.
When there are several instructions with the same call stack, like in this case, the call stack is only shown for the first instruction with a particular call stack. When there are many different locations invoking a particular function, there would be many alternative call stacks. Freja displays the dominant one, along with a percentage that describes the fraction of calls coming from that particular call site.
Depending on the call stack analysis depth, it can happen that the same instruction is reported more than once in an instruction group or a loop. In this case, the analysis engine has differentiated the statistics for this instruction depending on which functions it was called from.
The loop is the primary interesting structural element of a program from a cache performance standpoint, see Section 4.2, “Loops”.
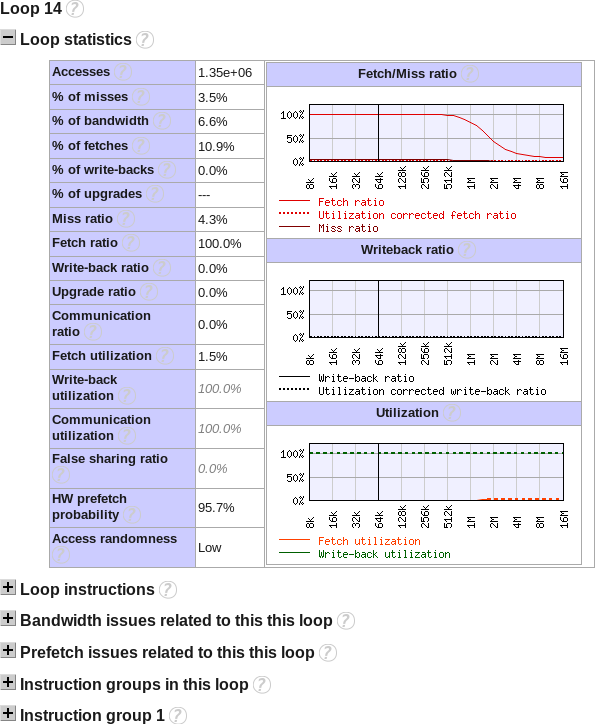
When the issue frame is displaying a loop it contains these sections:
Loop statistics
Statistics for the instructions of the loop, see Section 7.1, “Statistics”.
Loop instructions
List of all the instructions of the loop, see Section 7.4.2, “Instructions”.
List of all issues related to this this loop.
Instruction groups in this loop
List of all instruction groups in the loop, with some statistics.
Instruction group
There is a section for each instruction group in the loop. It contains statistics for the instruction group, a list of issues the instruction group is involved in and a list of the instructions in the instruction group.
There are a few common sections that occur in many of the issue types:
Instructions previously writing to related data
Points to the previous locations in the source code where the data structure involved in the issue was written, making it easier to determine which part of a complex expression is involved in the issue. See Section 4.4, “Last Writer” for more information. Some types of issues also point to the next instruction writing to related data.
All numbers presented here are in reference to the entire loop containing the memory instructions involved in this performance issue, see Section 7.1, “Statistics”.
Lists all the instructions in a loop. See Section 7.4.2, “Instructions”.
The exact contents of the issue frame varies with the type of issue, see Chapter 8, Issue Reference for more information about specific issue types.
| |  | |
| 7.3. The Summary Frame |  | 7.5. The Source Code Frame |