Difference between revisions of "NAMDPerformance"
| (5 intermediate revisions by 2 users not shown) | |||
| Line 1: | Line 1: | ||
=NAMD Performance Study= | =NAMD Performance Study= | ||
| − | NAMD is written in [http://charm.cs.uiuc.edu/ | + | NAMD is written in [http://charm.cs.uiuc.edu/ Charm++] and thus has some unique attributes when profiled by TAU. For example the Charm++ scheduler, which assigns task to processors and helps in load balancing the program, has a notion of idling while waiting for tasks to complete. Thus TAU creates an event to capture time spent when the scheduler is in its idle state (Idle) as well as an event (Main) to account for the communication latencies. You can see how NAMD performs on different hardware with these charts: |
| + | [[Image:intrepid-ranger-breakdown.png]] | ||
| − | + | Whereas on Intrepid (BlueGene P) Idle time (red) increases as NAMD scales, on Ranger (Sun x86 cluster) Main time increases (blue). This shows how Ranger's relatively slower communications layer results in larger latencies as NAMD scales compared to how NAMD scales on Intrepid. | |
| + | |||
| + | |||
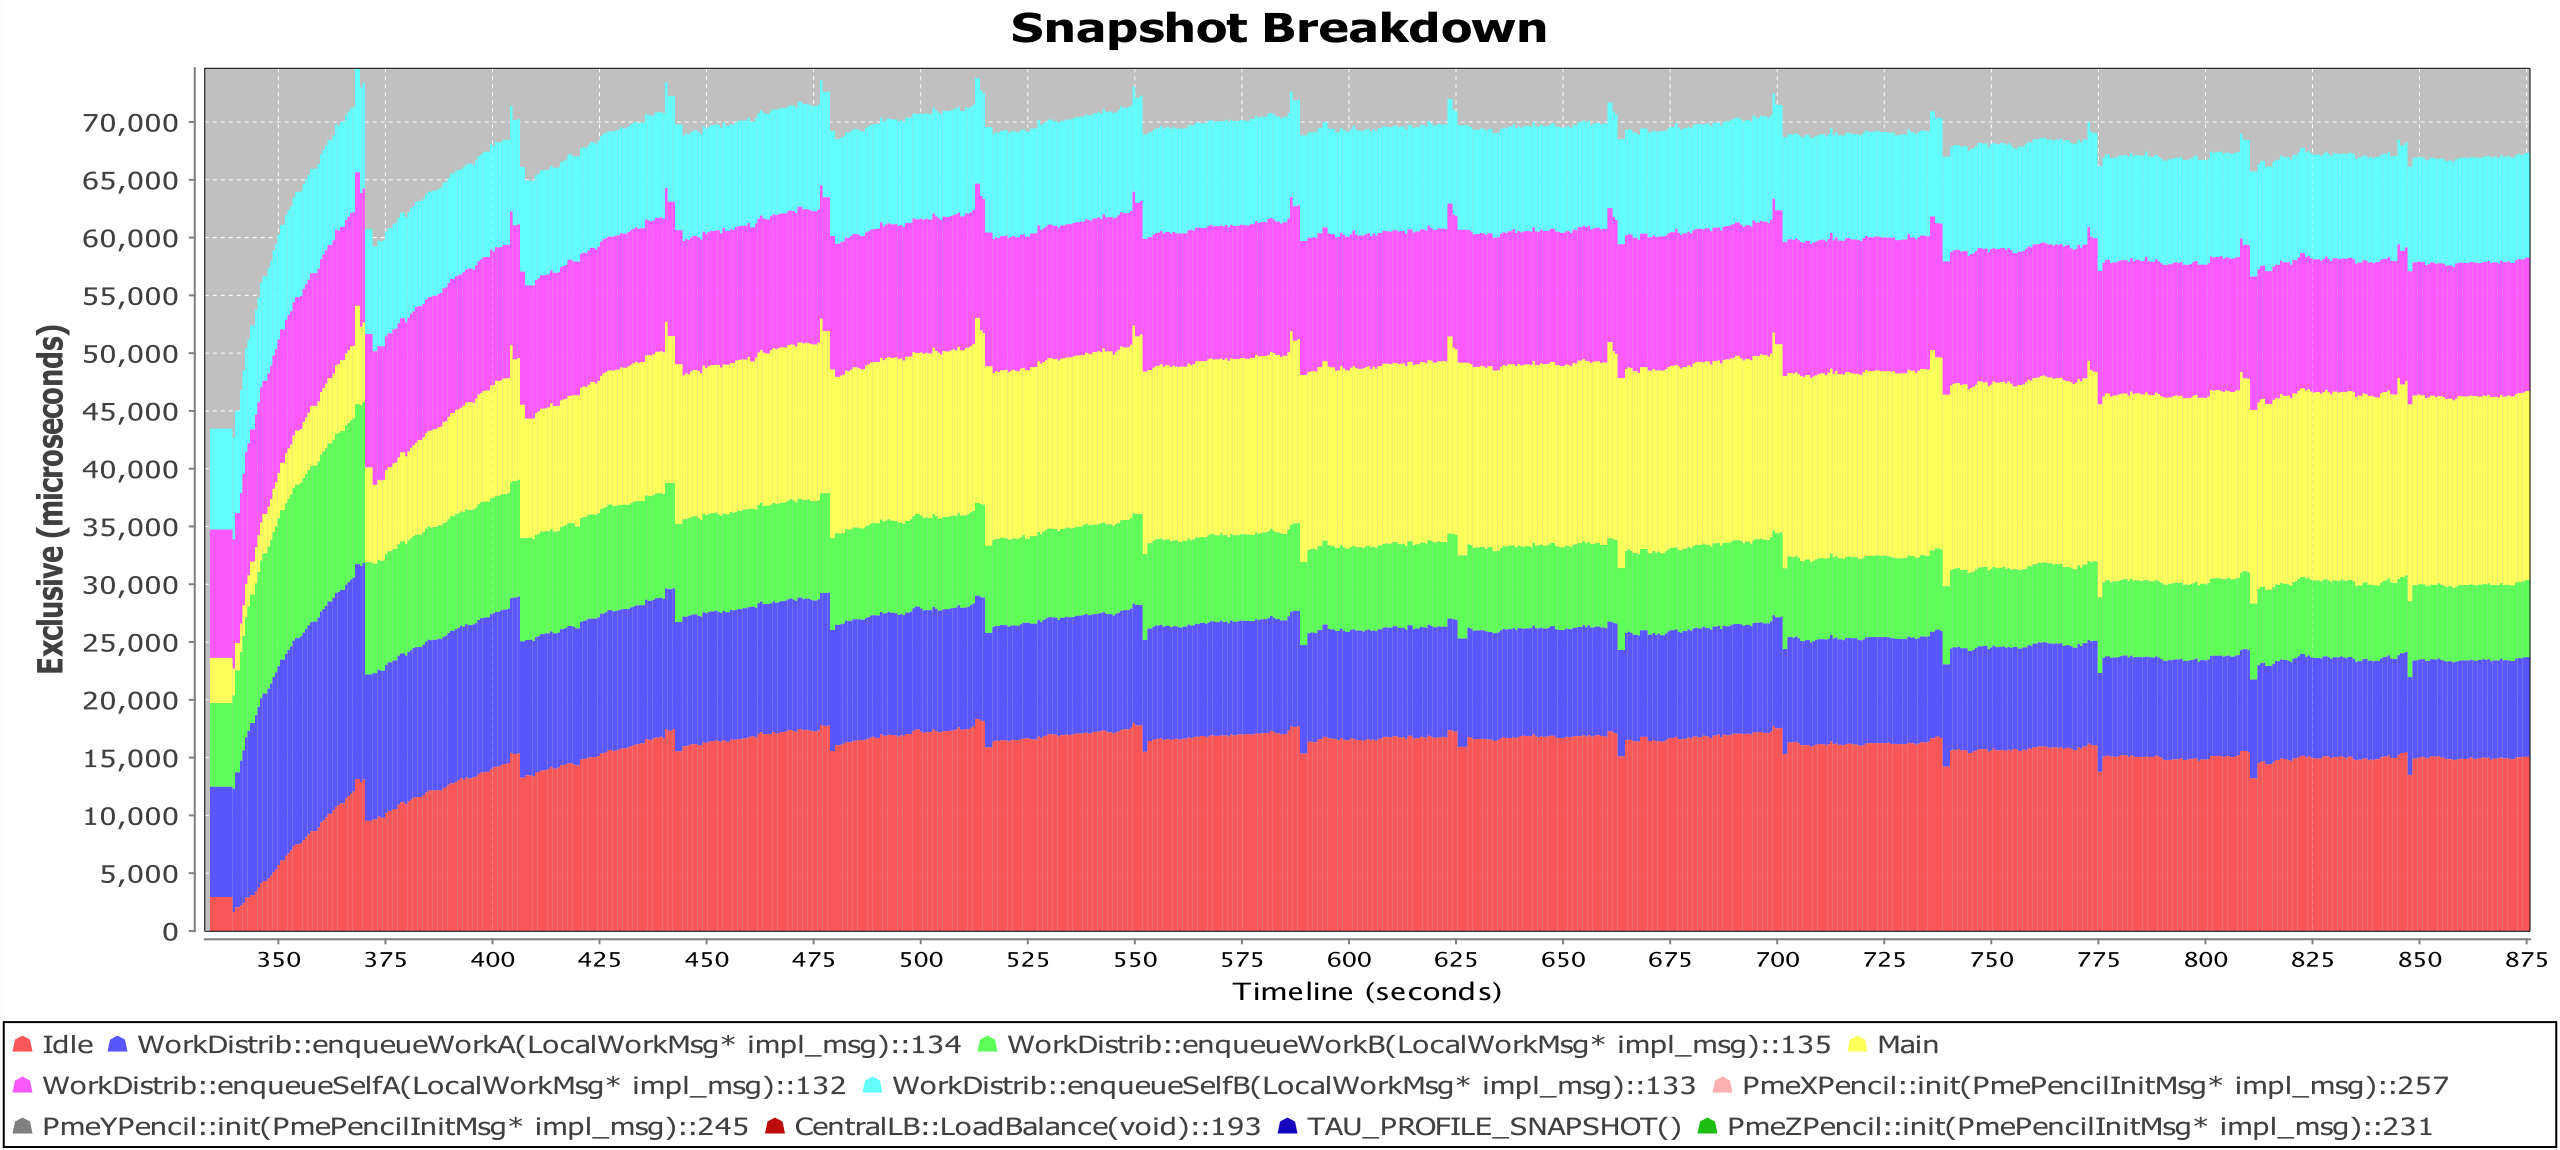
| + | The ability of NAMD to scale to a large number of processors is highly dependent on how it is configured. Many options are provided to tweak NAMD's performance structure to optimize performance for different simulation parameters and machines. So instead of focusing on NAMD's scaling behavior, we showed how TAU can identify other performance aspects of NAMD. This chart shows the the increasing variation across processors for varius NAMD events. Notice how after each load balancing phase the divergence among processors is temporally arrested. | ||
| + | |||
| + | [[Image:namd-deviation-snapshot.png|800px]] | ||
Latest revision as of 21:18, 14 July 2009
NAMD Performance Study
NAMD is written in Charm++ and thus has some unique attributes when profiled by TAU. For example the Charm++ scheduler, which assigns task to processors and helps in load balancing the program, has a notion of idling while waiting for tasks to complete. Thus TAU creates an event to capture time spent when the scheduler is in its idle state (Idle) as well as an event (Main) to account for the communication latencies. You can see how NAMD performs on different hardware with these charts:
Whereas on Intrepid (BlueGene P) Idle time (red) increases as NAMD scales, on Ranger (Sun x86 cluster) Main time increases (blue). This shows how Ranger's relatively slower communications layer results in larger latencies as NAMD scales compared to how NAMD scales on Intrepid.
The ability of NAMD to scale to a large number of processors is highly dependent on how it is configured. Many options are provided to tweak NAMD's performance structure to optimize performance for different simulation parameters and machines. So instead of focusing on NAMD's scaling behavior, we showed how TAU can identify other performance aspects of NAMD. This chart shows the the increasing variation across processors for varius NAMD events. Notice how after each load balancing phase the divergence among processors is temporally arrested.

